new
improved
General
Docs
Scope
File Manager
Timeline
Kanban
Verify
Live Dashboards in Docs - No More Export-Import-Update-Repeat
Your model checking data already lives in Plannerly. Now your dashboards do too.
We have added dashboards directly inside the Docs module - charts that pull straight from your Verify tasks and update themselves automatically. No exporting to Excel. No copying numbers into a slide deck. No "let me just update this before the meeting" panic.
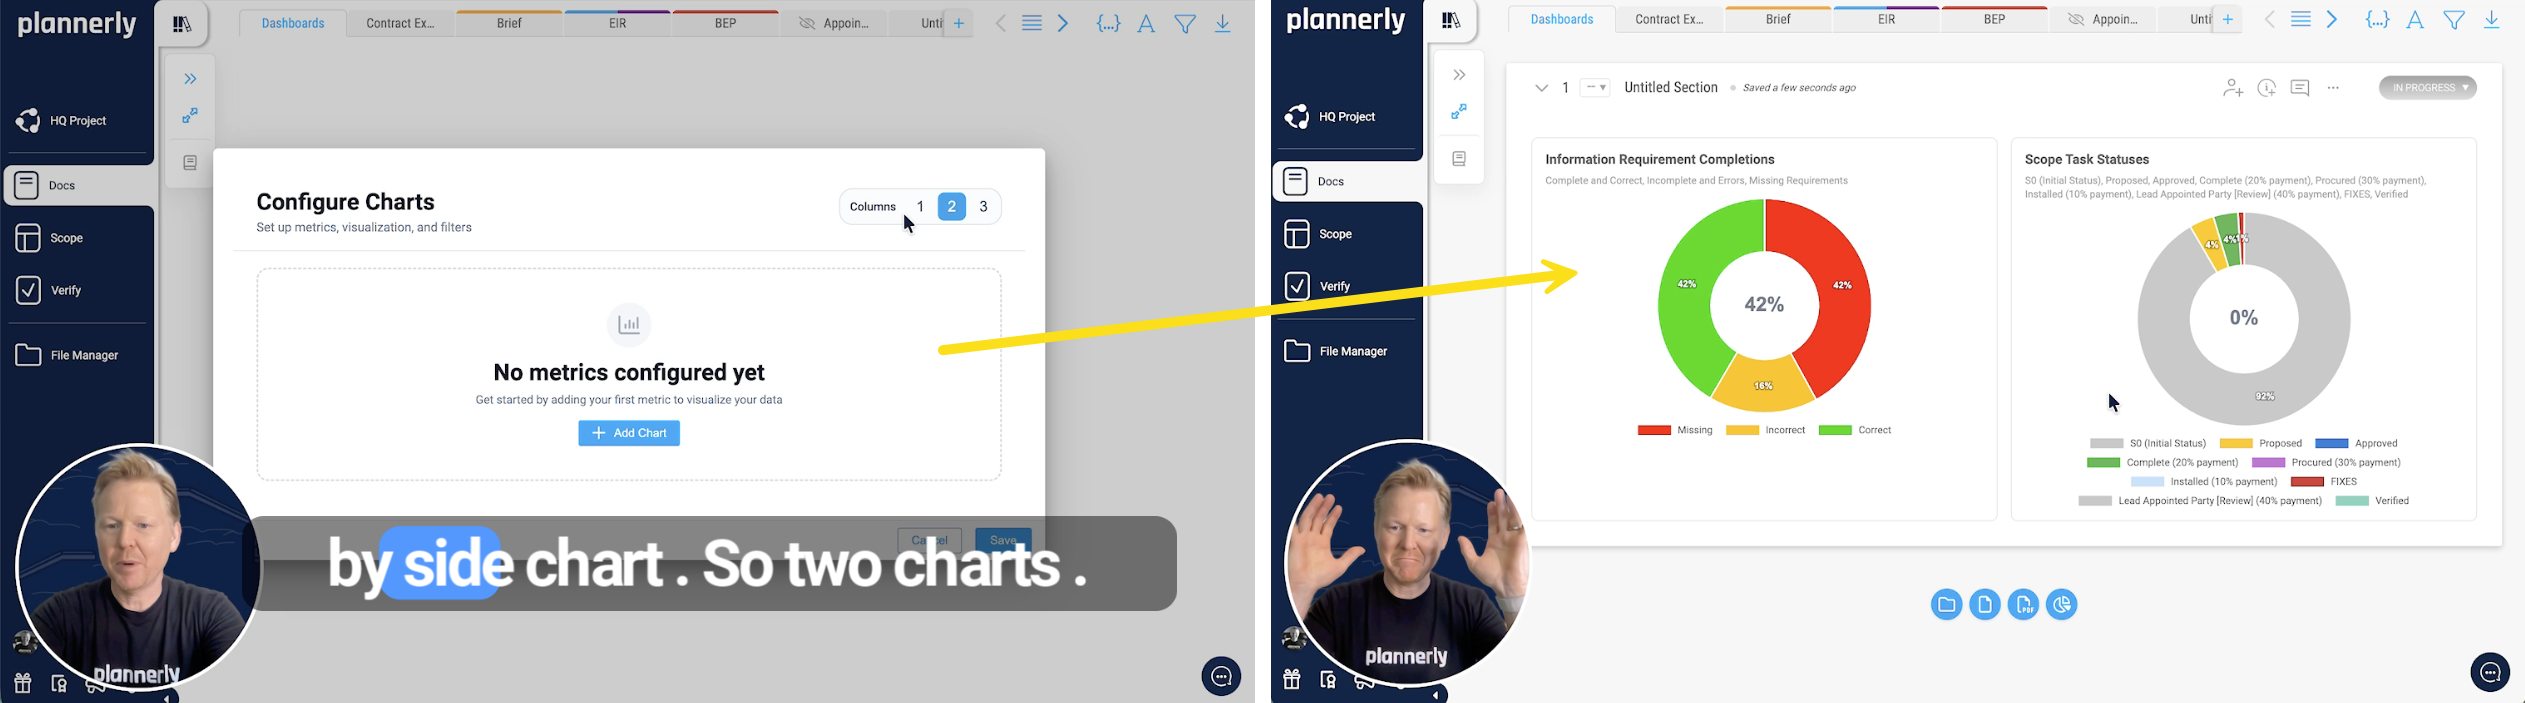
How it works
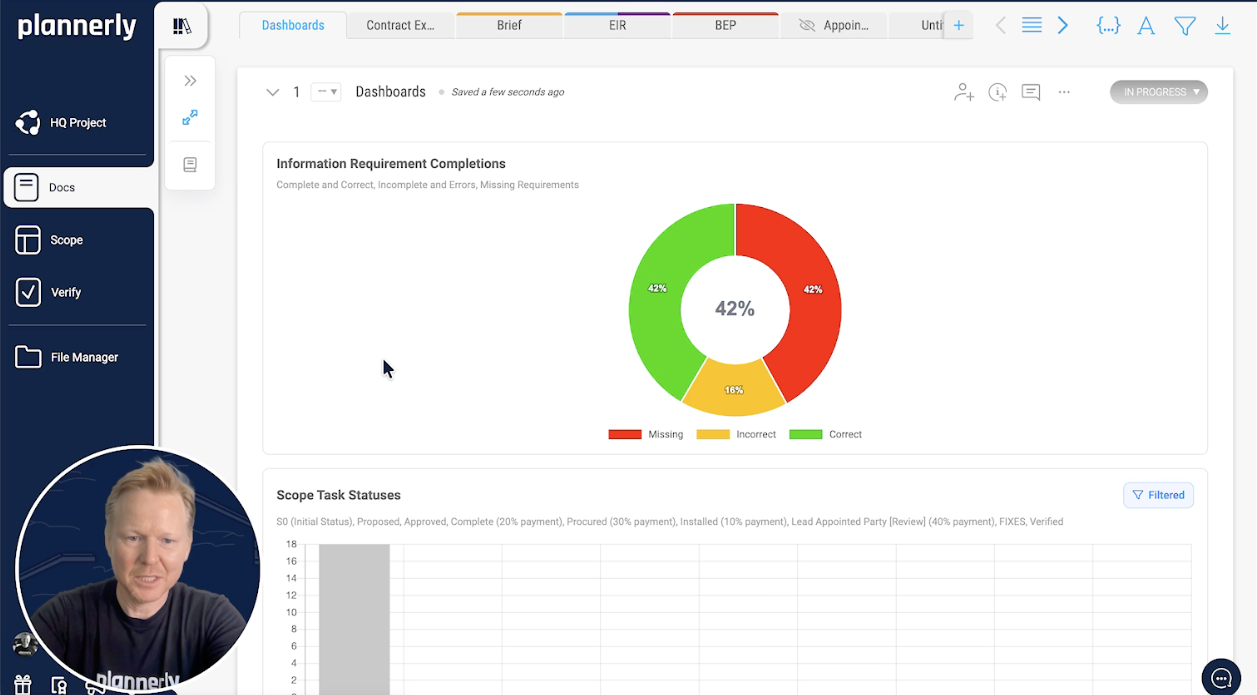
Create a new document in Docs, add a chart block, and you are done. Seriously - that is it. Choose side-by-side or stacked layouts, pick your chart types, and the data flows in from your existing tasks.
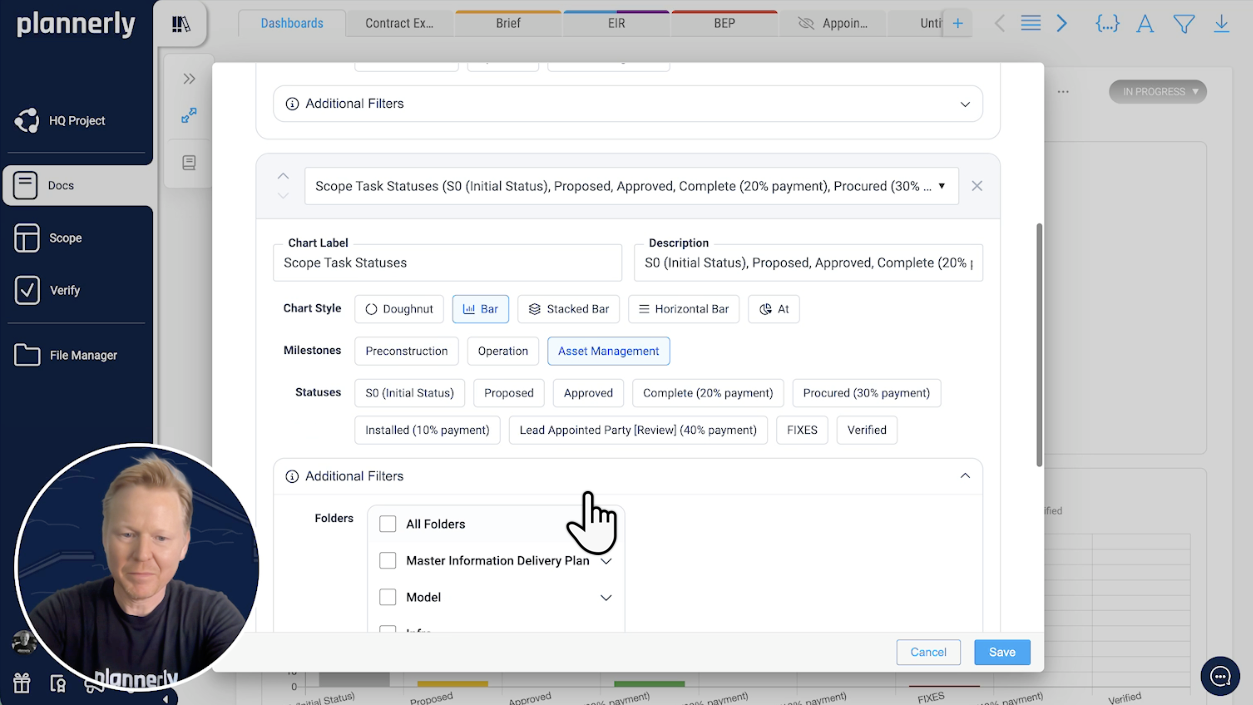
Filter for the right audience
Not everyone needs the same view. Filter your dashboards by milestone, status, team member, or team - then save. Create one dashboard for the project lead showing overall progress, another for the mechanical team showing just their workload. Each one tells a different story from the same data.
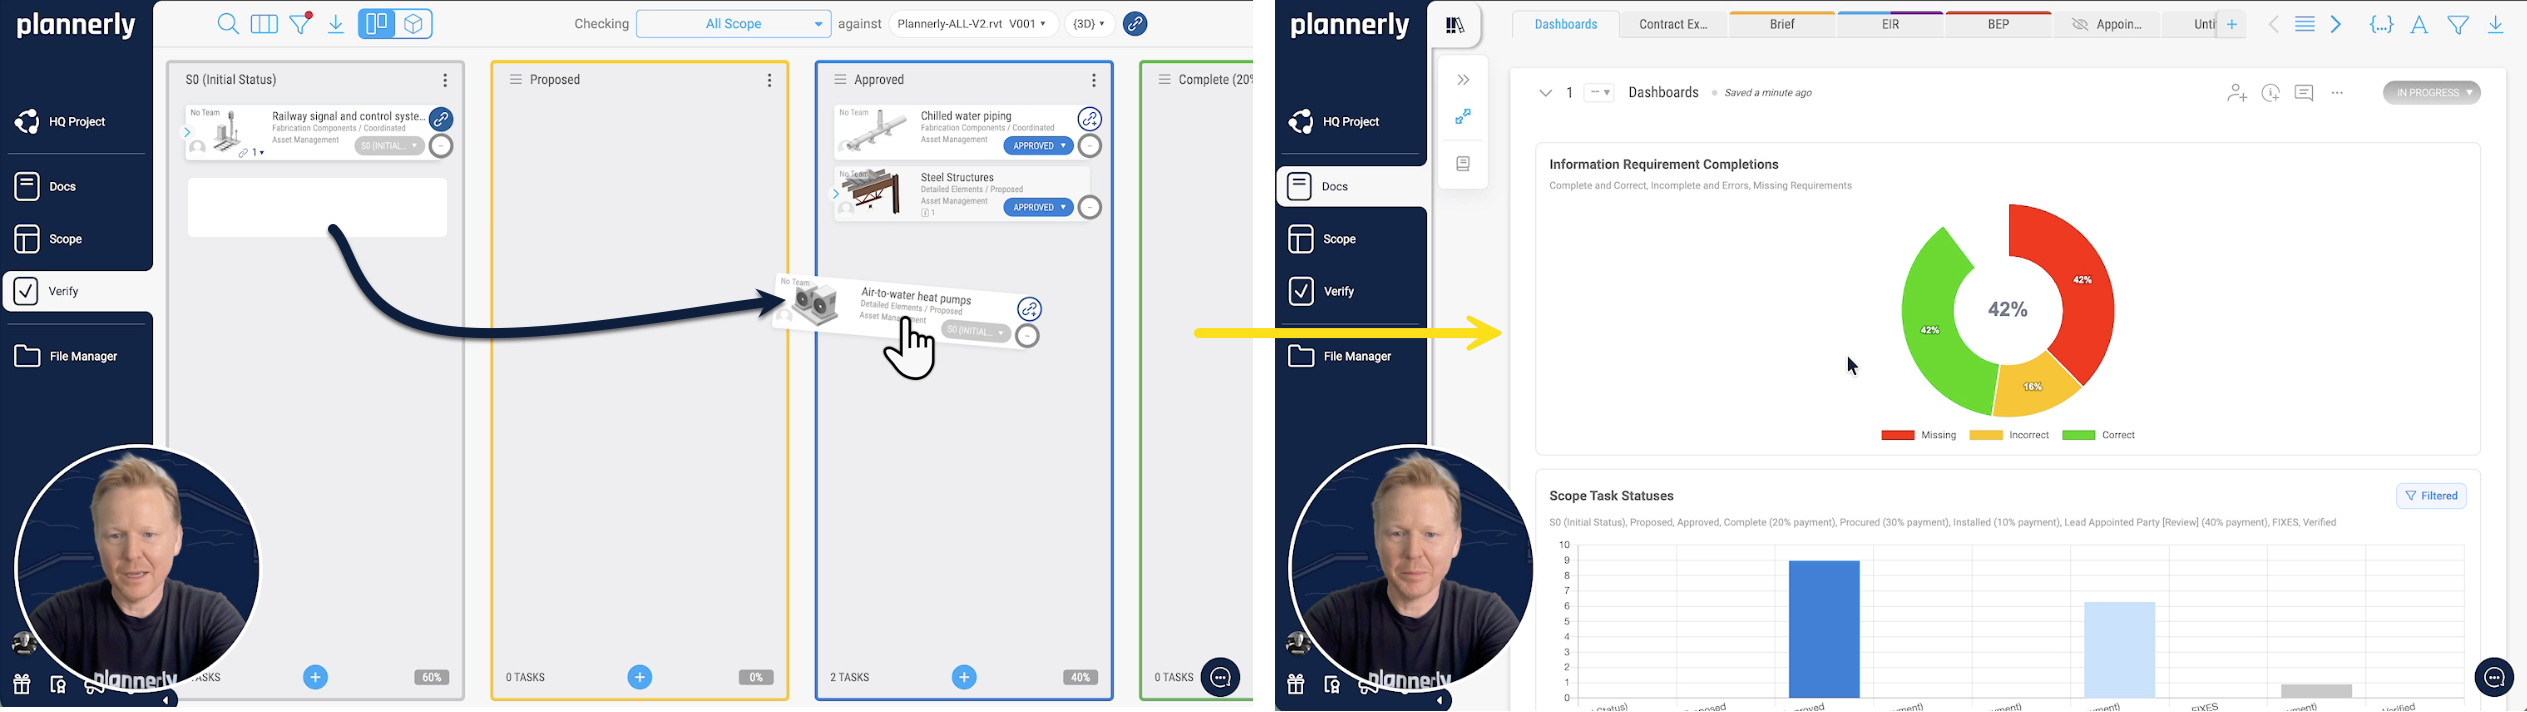
Always up to date - zero effort
This is the bit that kills the old workflow dead. When your team drags tasks across the Kanban board, changes a status, or completes a deliverable - the dashboard updates automatically. Go back to your dashboard and it already reflects what just happened. No refresh button. No re-run. Just current data, all the time.
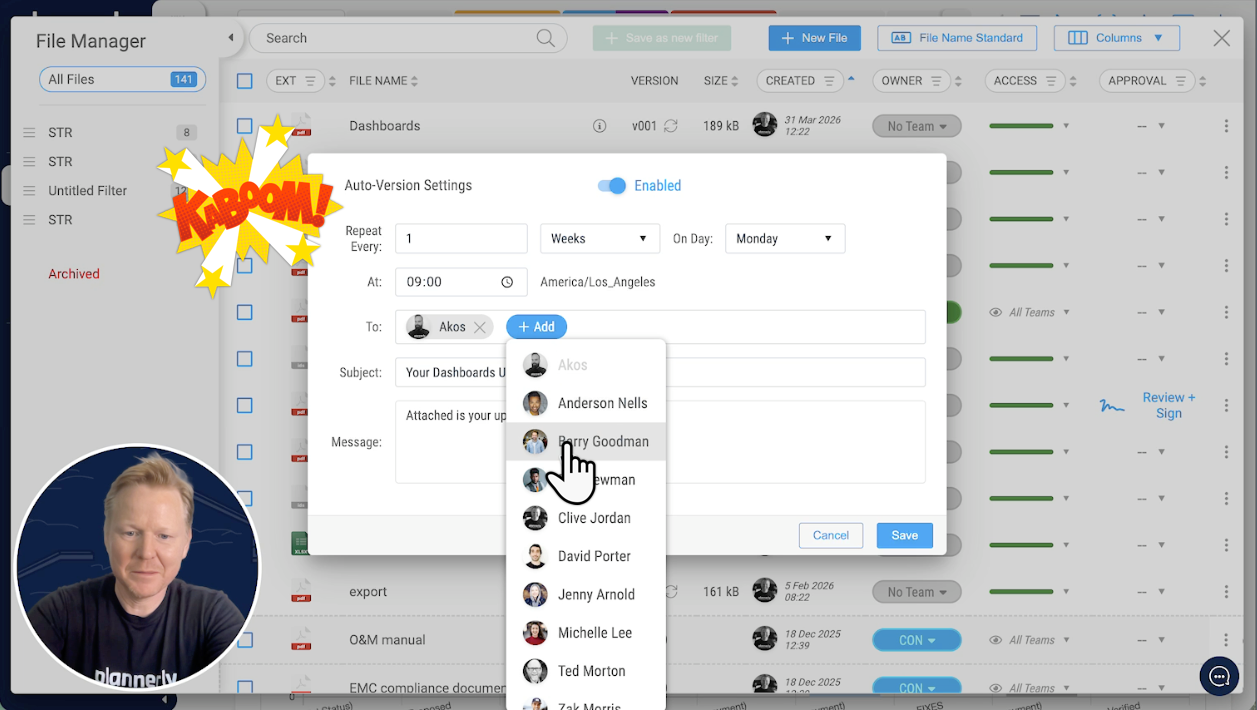
Automated weekly reports
Set up auto-versioning and schedule a weekly PDF export - say Monday mornings at 9 AM. Pick your recipients, write a brief message, save. That is it. Every Monday your team gets a fresh dashboard report in their inbox and you did not have to do a single thing.
No more exporting to Excel, updating a separate dashboard, converting to PDF, uploading to Teams, and hoping nobody asks for the latest version. It is all one workflow now.
The old way:
Export data → open Excel → build charts → format → PDF → email → repeat next week → cry a littleThe new way:
Add a chart block → done. It updates itself. Forever.